The Constellation Fund develops and uses an evidence-driven framework for assessing the impact of poverty-fighting programs in our community. By utilizing analytics to harness the best available information, we power each of our grantmaking decisions with objective insights to help maximize lifetime impact.
METRICS
When impact gets measured, what works can grow

How it works
Our Evidence-Driven Approach
Expertly built for our community, Constellation’s metrics bring world-class quantitative analysis to local philanthropy in the Twin Cities.
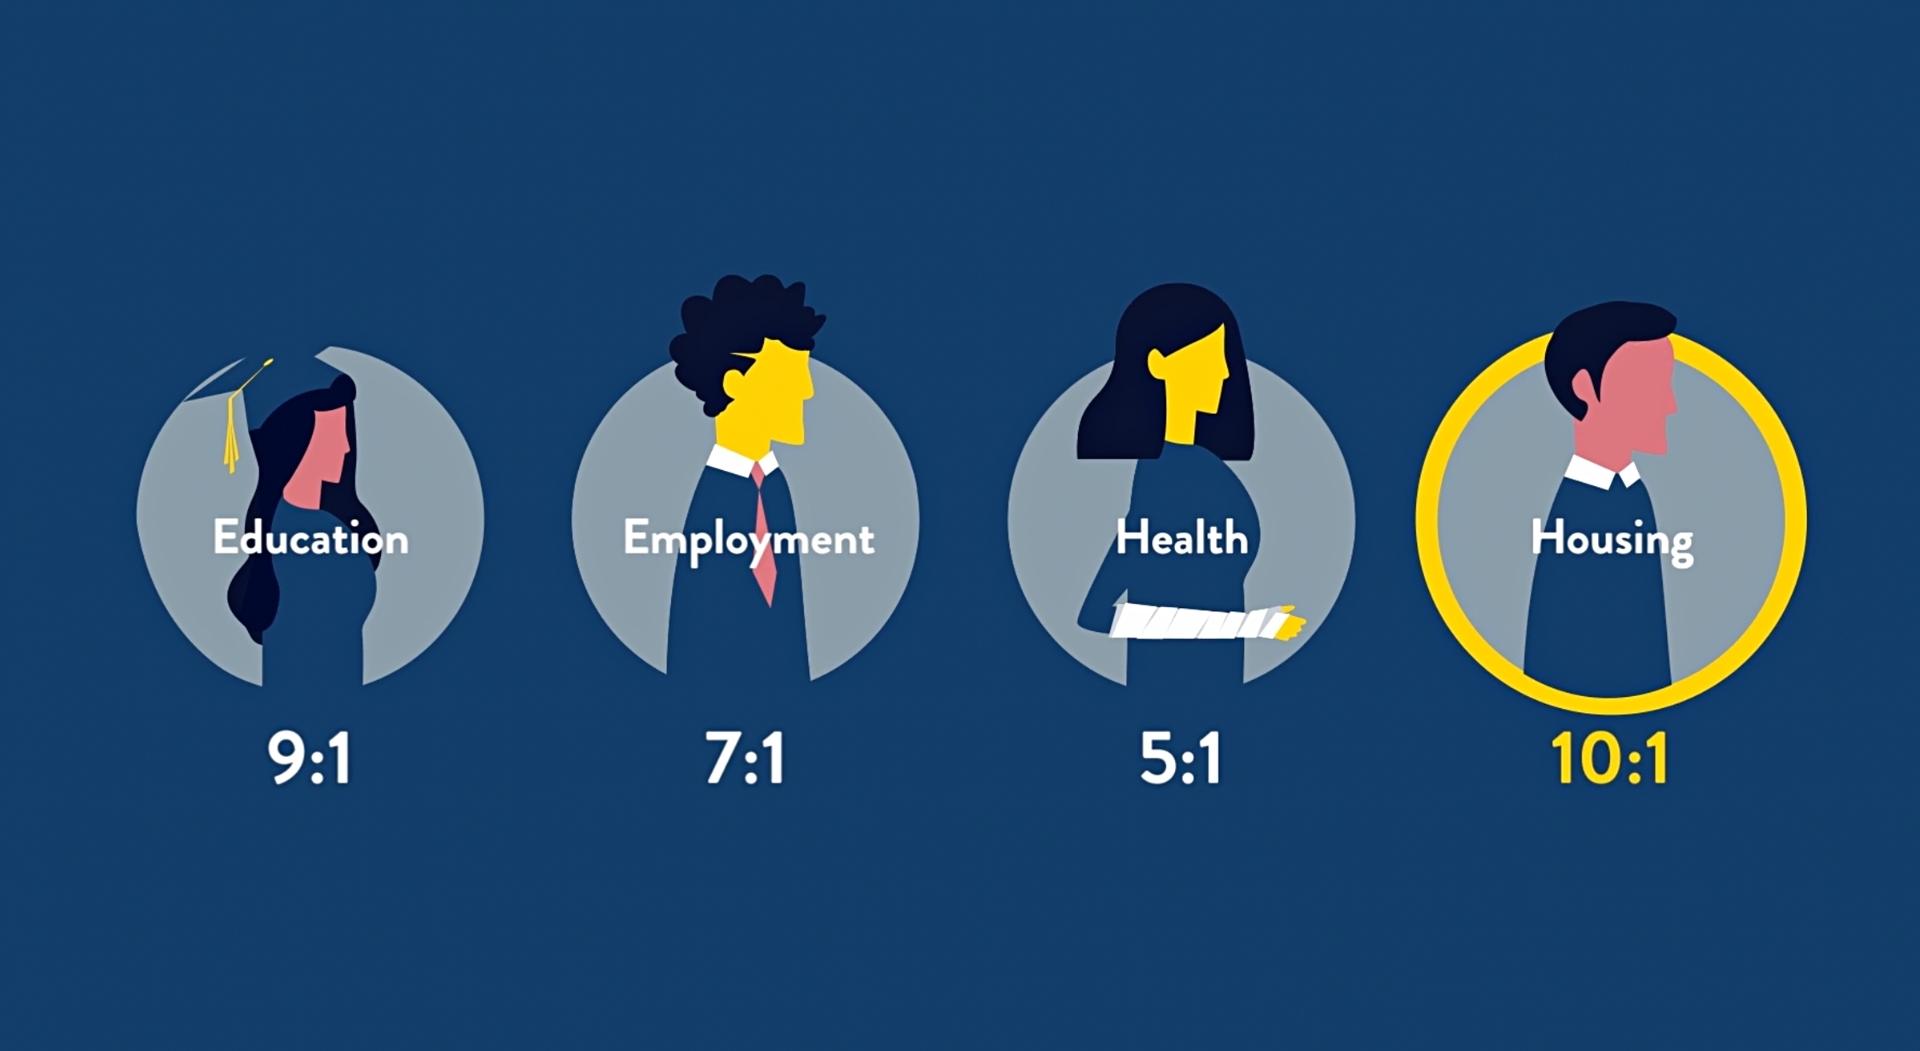
Through our metric-driven approach, Constellation uses the best available evidence to carefully value the measurable improvements that poverty-fighting organizations are projected to create for people living in poverty, an evaluation that results in a benefit-cost ratio used to help build a portfolio of nonprofits creating transformational impacts. On average, our grantees are projected to turn every dollar invested into more than $10 of poverty-fighting impact in our community.
Watch this short illustrated video for a simplified summary of how we uncover that impact by using evidence.
How We Build Our Metrics
Constellation works alongside leading economists, researchers, and issue-area experts to identify and effectively leverage the best available information for use in our metrics. This information comes from many different sources: peer-reviewed research, local demographic data sets, nonprofit partners, and beyond. That evidence is then carefully and continually incorporated into Constellation’s metric-driven evaluation framework.
This work requires considerable expertise. We employ an in-house economist and talented impact staff who draft and apply our metrics, all with support from the Constellation Impact Council, a group of the state’s leading economists who help to bolster the integrity of our work.
The process of building and refining all of the metrics needed for a full evaluation can take six months – here is a brief video about how we do it.
Why we build metrics
The moment a donation is made, the donor has necessarily made a value judgment about every other critical program or service that could have been funded instead. At Constellation, we believe that informing these philanthropic decisions with the best available tools and information has a far better chance of leading to the lasting impacts that we all seek.
By using evidence to measure the projected poverty-fighting benefits of a program, Constellation can then create a benefit-cost analysis for each prospective nonprofit grantee. This allows for outcome-driven comparisons between the impacts of different types of organizations and interventions.
Once Constellation has conducted these rigorous quantitative analyses, we carefully weigh them alongside key qualitative considerations in an effort to allocate the resources of our donors to the programs with the largest poverty-fighting impacts.
Our Metrics Evaluation Framework
Constellation works alongside leading economists, research organizations, and issue-area experts to build and continually refine our metrics, which are used alongside on-the-ground qualitative insights to power our work.
View our book of metrics
CONSTELLATION’S METRICS ARE
A STANDARD FOR COMPARING OPPORTUNITIES
Metrics allow for the weighting of similar and dissimilar programs.
A TOOL FOR ACHIEVING TRANSPARENCY
Constellation welcomes outside voices to examine, critique, and improve our metrics.
A SYSTEM FOR IDENTIFYING INSIGHTS
What do the highest-scoring programs have in common? The lowest?
A METHOD FOR ASSESSING CONSTELLATION
We measure our own impact the same way we measure our grantees: how much poverty we eliminate with each dollar we spend.
CONSTELLATION’S METRICS ARE NOT
THE ONLY CRITERIA FOR MAKING GRANT DECISIONS
Qualitative evaluations and assessments of community needs are also central to our grantmaking.
REPORT CARDS ON PROSPECTIVE GRANTEES
A nonprofit can fulfill its own mission without scoring high on Constellation’s metrics.
EXACT AND UNCHANGING
Neither the data we capture nor the formulas we apply are perfect, and the metrics are designed to evolve with additional research and refined calculations.
THE ONLY APPROACH TO SMART PHILANTHROPY
Other funding organizations may employ different but useful standards.
How we think about evidence

At Constellation, we prioritize evidence over anecdotes. But how do we think about using that evidence to better understand poverty-fighting impact?
The evidence behind our metrics comes from many different sources – research, local data sets, nonprofit partners, and more – and we believe that harnessing the best of this information is essential to the progress that we all seek. Yet we also believe that this tapestry of knowledge must be put in its appropriate context and used with humility and care in order to make decisions that best meet our mission of effectively fighting poverty in the Twin Cities.
This video touches on how Constellation works to approach the use of evidence – and particularly peer-reviewed research – with that context, humility, and care.
More About Our Metrics
Metrics 101
At their core, each of Constellation’s metrics combine three key layers of information to create benefit-cost analyses that measure the expected long-term, poverty-fighting impact for every dollar we invest:
- Peer-Reviewed Research: Constellation uses the best available information. Ideally, this is long-term longitudinal outcome data from nonprofits, but that rarely exists. When it does not, Constellation uses the most credible and relevant peer-reviewed research to help understand the likely measurable lifetime outcomes that a given poverty-fighting intervention will create for low-income individuals and families.
- Counterfactuals: To truly understand the impact of our grants, Constellation compares the outcomes for participants in a given program against what would have happened had they not participated. A school that graduates 95% of its students sounds impactful, but if 90% of those students are high-performers who would have graduated anyway, the impact of the school isn’t as big as it might seem. To account for this, a counterfactual serves as a benchmark against which to compare outcomes. This is often created by leveraging local demographic information (e.g. from census data) to estimate what, on average, is happening in the lives of participants without support, and then subtracting that estimate from the expected outcomes so it captures only the actual impact of a potential investment.
- Nonprofit Data: Constellation uses the information that poverty-fighting organizations generally do have — how many people they are serving, the demographics of those participants, the financial cost of their programming, and more — to tailor the metrics to the realities of the specific organization up for evaluation.
This information (and plenty more) is then carefully built into a metric with the following basic structure:
Poverty-Fighting Benefits = (Number of Participants – Counterfactual) x (Outcome – Counterfactual) x Monetary Benefit
- Number of participants: This information is provided by the potential grantee about the number of low-income individuals being served.
- Counterfactual: This is based on local demographic information and helps to estimate the net impact of the program (i.e. what would have likely happened to participants without the program).
- Impact Size: Often taken from peer-reviewed research, this represents a measure of how much a given program changes poverty-fighting outcomes for its participants (e.g. percentage increase in graduation rates).
- Monetary Benefit: This is an estimate of poverty-fighting value that a participant would gain from the quality-of-life improvements of a given intervention (e.g. the value to low-income community members of the improvements to education, health, or income). We only value a program’s benefits to members of our community who would face poverty, not benefits to the general public or high-income individuals.
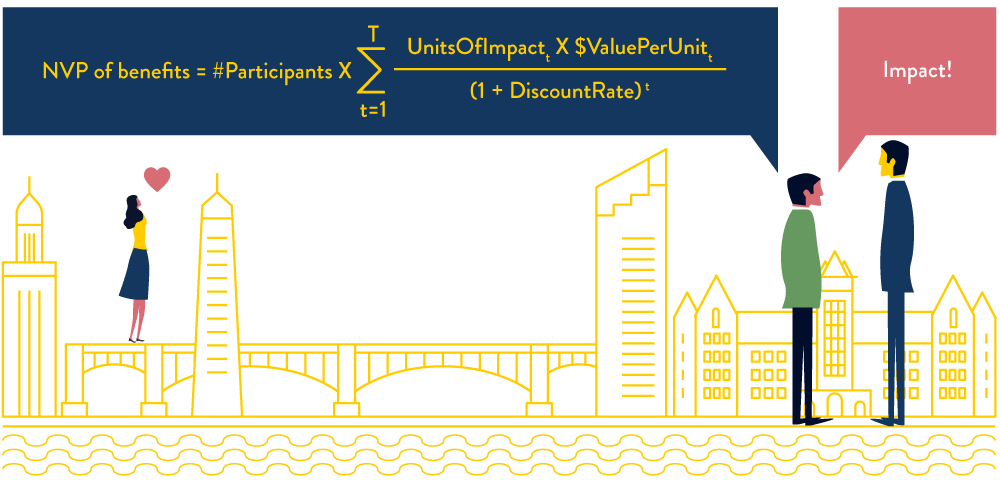
Since a dollar today is worth more than a dollar in the future, Constellation discounts future benefits and values all benefits in today’s dollars. The net present value (NPV) expresses the present value of a stream of future benefits.
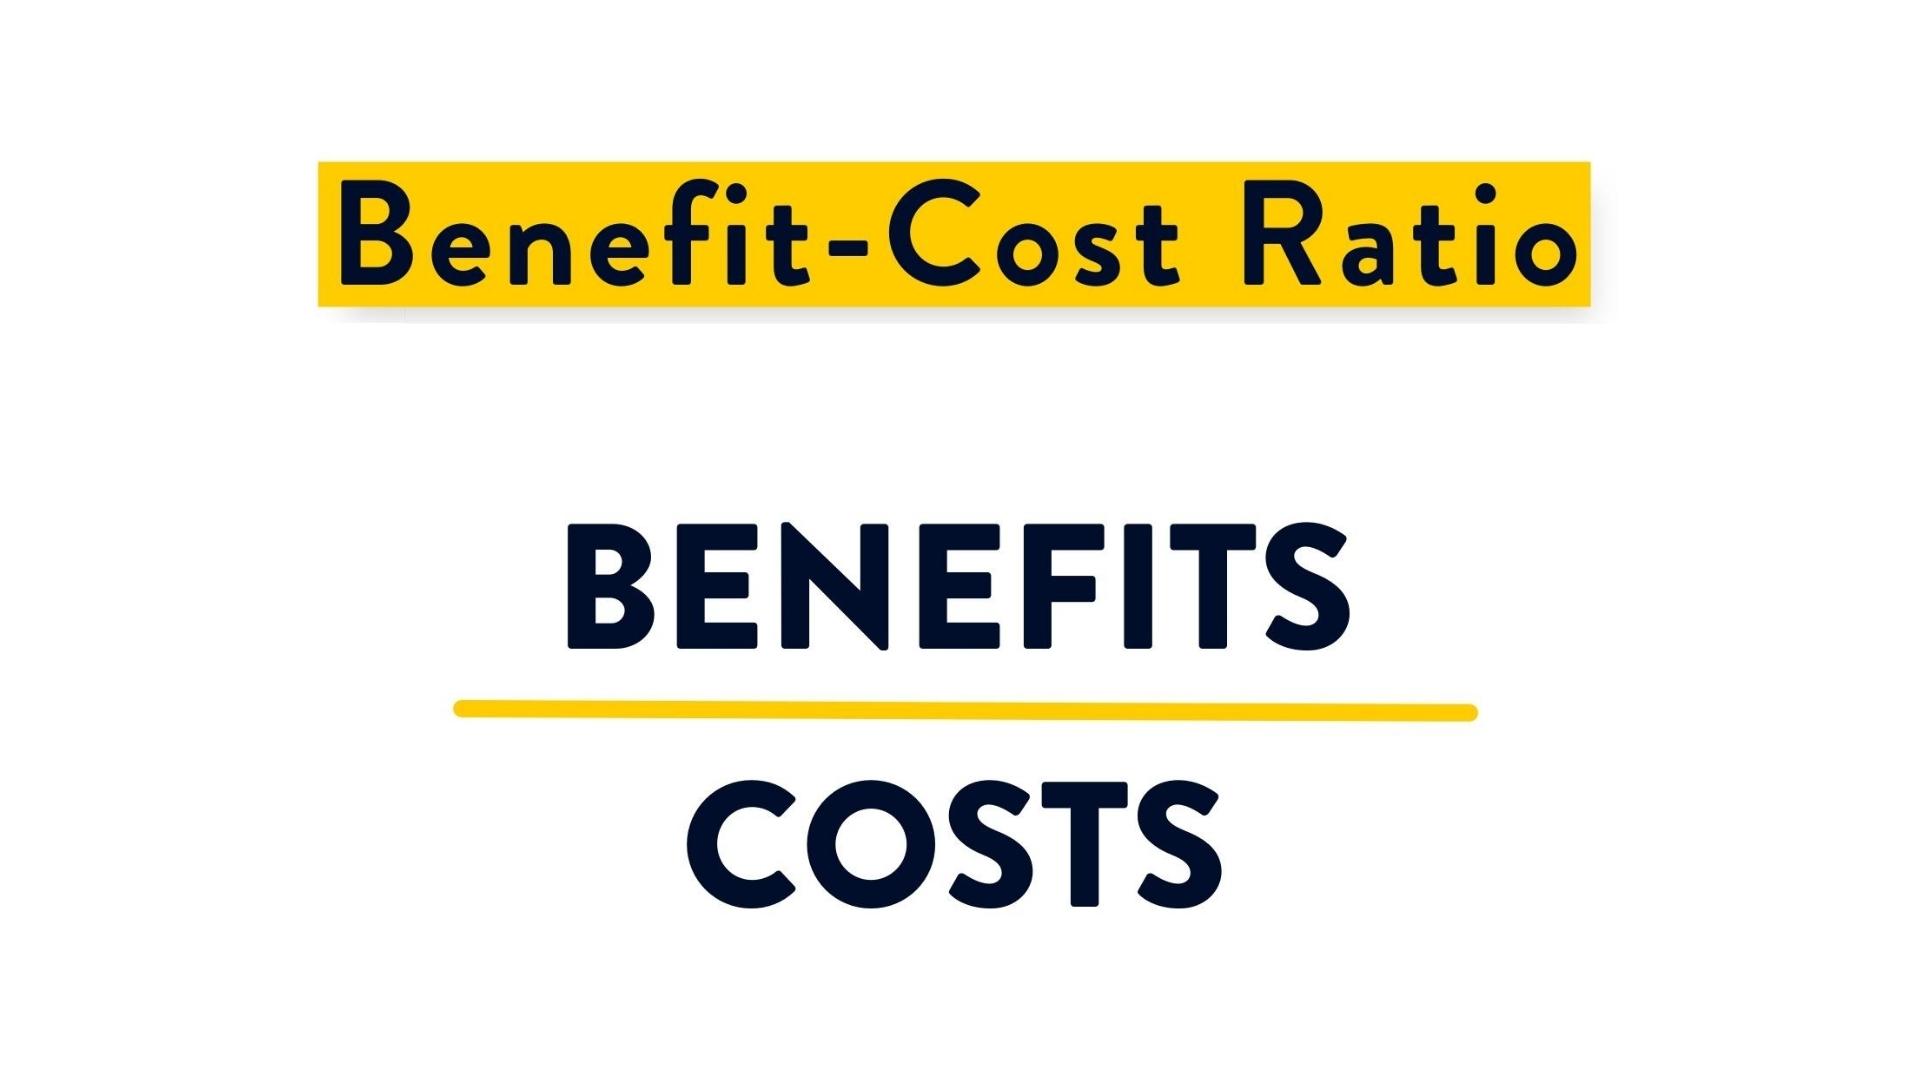
Constellation estimates as many of the poverty-fighting benefits of a program as possible using our metrics, then divides the sum of benefits by the total program and administrative cost to calculate a benefit-cost ratio.

The benefit-cost ratio creates a common scale, which allows comparisons of impact between otherwise incomparable outcomes.
Metrics Deep Dive
Constellation estimates the expected benefits of a proposed program investment based on a general model of the value of the stream of expected future benefits for low-income individuals and families. Each metric seeks to estimate the net present value of outcomes for the participants in a program.
Program impacts are estimated based on evidence from evaluation results of individual programs or average effect sizes from several evaluations. Constellation compares the estimated benefits to the cost for an organization to generate these benefits. The result is a benefit-cost ratio that indicates the value of the poverty-fighting benefits received by participating individuals for every dollar used to run the program. Benefit-cost ratios can be used to compare similar interventions, as well as programs with otherwise non-comparable outcomes.
Each metric follows the following basic structure:
Example
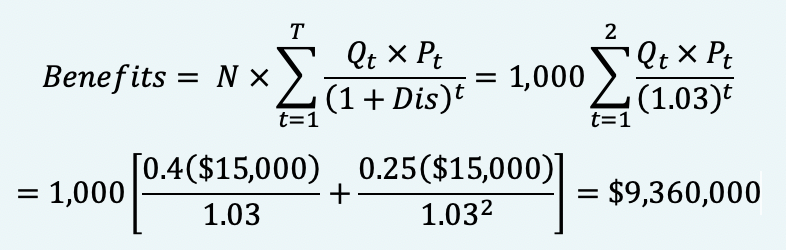
For a proposed job-search assistance program, Q1 would be its average expected impact on potential participants’ employment probability in the first year. Suppose the proposal is to assist 1,000 participants.
If the grant is funded and 1,000 are assisted, then suppose 900 will be employed at the end of the year. If the grant is not funded, then only 500 would be employed after a year. Q1 would then equal a 40% increase in participant employment probability. Suppose that at the end of the following year, 850 would be employed if the assistance program were funded and 600 would be employed if not. Then, Q2 would be 25%. Suppose after that, there was no difference in employment probabilities.
Pt would equal the average earnings among employed participants at t years post-program. Suppose this is $15,000 in earnings beyond what each participant would have received without the program, each year.
Let’s assume a 3% discount rate and 1,000 participants.
Then, our estimate of the value of the proposal’s benefits would be:
General Metrics Assumptions, Considerations, and References
General Assumptions
These assumptions apply to all the metrics in Constellation’s metrics evaluation framework.
- The Constellation Fund calculates private monetary benefits for program participants, generally for individuals at or below 185% of the federal poverty guideline.
- All monetary values are converted to constant dollars.
- Present values are calculated using discount rates of 2%-4% of future values.
- All earnings are net of taxes. For state taxes, we use effective tax rates by income percentile from the Minnesota 2017 Tax Incidence Study (Minnesota Department of Revenue, 2017).
- For federal taxes, we use federal effective tax rates by expanded cash income percentile reported by The Tax Policy Center (Urban Institute and Brookings Institution, 2016).
- As a general rule, the evaluator should check that the grantee’s intervention matches as closely as possible with the program models observed in the literature. Other matching factors may include characteristics of population served, intensity/dosage of program, and quality of program.
Additional Considerations
- The general equation does not include any differential weights on dollar gains for participants’ based on income or other factors. The Robin Hood Foundation experimented with using weights on gains but found no basis for choosing the weights, and, regardless, their weighting methods did not affect the relative ranking of grant proposals (Weinstein and Bradburd, 2013).
- The general equation does not include the value of any cash and noncash public transfer payments or benefits received or potentially lost due to increases in income.
- To determine average annual post-program earnings, we must consider potential issues with data reported by programs, including bias/error from self-reported earnings and spotty or missing data. Ideally, data should come from tax returns, verified income from employers, the Department of Employment and Economic Development, or other government agencies.
- Most subpopulation data is based on American Community Survey (ACS) microdata for the smallest relevant geographic area.. If the sample size is too small for a specific subgroup (such as race, immigration status, level of education, etc.), we use data for the full seven-county Twin Cities region or a larger geographic region where needed. If the population of interest is not found in Census data, we use third party reports.
- To determine the counterfactual state of earnings or other outcomes in the absence of any program, we often use average earnings or other status factors of the target population in the Twin Cities area based on Census data. This average value or rate serves as an ad-hoc threshold for program impact.
General References
Minnesota Department of Employment and Economic Development. (2017). Minnesota unemployment statistics. Retrieved from https://apps.deed.state.mn.us/lmi/laus/Default.aspx
Minnesota Department of Revenue. (2017). 2017 Minnesota tax incidence study. Retrieved from http://www.revenue.state.mn.us/research_stats/research_reports/2017/2017_tax_incidence_study_links.pdf
Urban Institute and Brookings Institution Tax Policy Center. (2016). Average effective federal tax rates – all tax units by expanded cash income percentile, 2016 [Model estimates – Distribution tables by percentile]. Retrieved from Tax Policy Center – Model Estimates
U.S. Census Bureau. (2016). American Community Survey 5-year estimates – public use microdata sample, 2012-2016. Generated using Public Use Microdata Area (PUMA) in the Seven-county Twin Cities Metropolitan Area. Retrieved from http://factfinder.census.gov
Weinstein, M. & Bradburd, R. (2013). The Robin Hood rules for smart giving. New York: Columbia University Business School Press. Retrieved from http://cup.columbia.edu/book/the-robin-hood-rules-for-smart-giving/9780231158367
Why Does Constellation Publish Its Metrics?
Constellation actively seeks input and feedback on and improvements to our metrics. We welcome community insights into new research to refine our metrics, ideas for new metrics, potential sources of data, and suggestions on how to refine and improve our methods. We value transparency and are committed to sharing the methodology behind our quantitative assessments. Lastly, we prioritize collaboration and are hopeful that other funders and policymakers will thoughtfully use these tools to inform decisions and help our communities move more effectively toward the shared goal of poverty alleviation.
Can I Conduct My Own Evaluations With These Metrics?
We encourage funders and policymakers to thoughtfully use these metrics. The process of estimating the poverty-fighting benefits associated with a given program is complex and labor intensive, and usually requires the careful adaptation of each metric to meet the specific characteristics of and available information on the program being evaluated. Put another way: Constellation’s metrics are not “plug and play” or “one size fits all” tools.
Effectively using metrics in the field involves a number of critical and interconnected steps. Constellation works closely with a given organization to develop an in-depth understanding of the poverty-fighting intervention, its processes, and its expected outcomes. We conduct a thorough literature review to verify that there is reliable evidence that the proposed intervention is indeed effective. We identify the characteristics of the populations targeted by the program to create baseline “counterfactuals” that serve as benchmarks against which to compare the outcomes. We determine and carefully organize the program data needed to apply the metrics, which varies based on the program. For instance, when a metric calls for the number of participants, a training program could provide the number of participants receiving the training, but Constellation would also need the average age, level of education, and the content and intensity of the curriculum, among other data; in many cases, these nuances are not explicitly called out in the metrics, so are the responsibility of our trained staff to identify and carefully include. Lastly, we work closely with leading experts – including a Ph.D. economist on staff and the group of leading economists on the Constellation Impact Council – to help ensure that the metrics are assembled and put to use accurately.
Acknowledgment of Contributors
Acknowledgements
For their significant contributions to the development of our metrics, Constellation would like to thank:
- The Robin Hood Foundation;
- Dean’s Office, Humphrey School of Public Affairs, University of Minnesota;
- Constellation Impact Council: Richard Chase, Aaron Sojourner, Judy Temple, Abigail Wozniak, and Mark Wright; and
- Wilder Research staff: Amanda Eggers and Jennifer Collins.
Research Partner
Wilder Research, a division of the Amherst H. Wilder Foundation, is a nationally respected nonprofit research and evaluation group. For more than 100 years, Wilder Research has gathered and interpreted facts and trends to help families and communities thrive, get at the core of community concerns, and uncover issues that are overlooked or poorly understood.
Help us be brighter
We are continually updating and improving our metrics with new research, data, and insights, and we welcome your help. One of the reasons we post our metrics online is to encourage feedback – and pushback – from the many brilliant people in the Twin Cities and around the world.
Share your feedback and tell us of relevant research and useful data you think we should know about. If you see a way to improve one of our metrics, we want to hear about it.